

AWS Cloud Monitoring: CloudWatch and Beyond for Full-Stack Visibility
AWS Cloud Monitoring: Complete Visibility Across Your Infrastructure
AWS cloud monitoring is the foundation of operational excellence and regulatory compliance for organizations across the United States. CloudWatch remains AWS’s native observability service, capturing metrics, logs, and traces from your applications running in us-east-1, us-west-2, and AWS GovCloud. However, modern enterprises require visibility beyond what CloudWatch alone provides. This guide walks you through CloudWatch’s core capabilities, where and why teams integrate Prometheus, Grafana, and third-party platforms, and how to build a cost-effective monitoring strategy that satisfies HIPAA, SOC 2, FedRAMP, and NIST CSF requirements.
CloudWatch: Native AWS Observability at Scale
CloudWatch is your first layer of AWS cloud monitoring, natively integrated with every AWS service. It collects metrics from EC2 instances, RDS databases, Lambda functions, and application load balancers without additional agents or configuration. For US-based healthcare organizations under HIPAA, CloudWatch’s encryption at rest and in transit, combined with AWS KMS integration, ensures patient data remains protected.
- Metrics: CloudWatch automatically publishes 15-month metric history at 1-minute or 5-minute granularity. Standard monitoring is included free; detailed monitoring costs $0.10 per metric per month in us-east-1 and us-west-2.
- Logs: CloudWatch Logs centralizes application and system logs from all your infrastructure. Ingestion costs approximately $0.50 per GB; storage runs $0.03 per GB-month. Teams managing FedRAMP-authorized workloads use log retention policies tied to audit requirements—typically 90 days to 7 years depending on regulatory mandates from HHS OCR.
- Alarms: CloudWatch Alarms trigger SNS notifications, Lambda functions, or Auto Scaling policies when thresholds breach. A single alarm costs $0.10 per month; composite alarms (combining multiple metrics) cost $0.50 per month. Organizations with strict availability requirements—financial services, healthcare—typically deploy 50–200 alarms per application stack.
- Dashboards: Build custom dashboards in minutes. The first three dashboards per AWS account are free; additional dashboards cost $3.00 each per month. Most US enterprises consolidate to 5–10 executive dashboards covering capacity, performance, and cost trends.
Metrics vs. Logs vs. Traces: The Three Pillars of Observability
Understanding the difference between metrics, logs, and traces is critical for designing an effective AWS cloud monitoring strategy. Each serves a distinct purpose and, combined, provides the full context needed to debug production incidents and demonstrate compliance to auditors.
Metrics are time-series data points—CPU utilization, request latency, error rates. They’re lightweight, queryable in near real-time, and ideal for alerting. CloudWatch stores metrics at $0.50 per custom metric per month (beyond the 50 free custom metrics). Use metrics to answer questions like: “What is my p99 API response time right now?” or “Has my RDS database connection count spiked?”
Logs are unstructured or semi-structured text records of application behavior, system events, and security events. CloudWatch Logs ingestion into us-east-1 or us-west-2 costs $0.50 per GB; storage costs $0.03 per GB-month. Organizations handling CCPA/CPRA personal data, or HIPAA-regulated health information, use structured logging with JSON to support fast search and automated redaction of sensitive fields. A typical mid-sized SaaS application generates 50–500 GB of logs daily, costing $15,000–$150,000 annually in CloudWatch storage alone.
Traces track requests as they traverse distributed systems—from a user’s API call through multiple microservices to a database query. AWS X-Ray records traces at $0.50 per million recorded traces, plus $0.50 per million retrieved traces. Traces are essential for latency analysis: they answer “Why did this request take 8 seconds?” Sampling rules let you trace 100% of errors while sampling 1% of successful requests, controlling costs in high-volume environments.
Beyond CloudWatch: Prometheus, Grafana, and Third-Party Platforms
As your AWS cloud monitoring needs mature, organizations often integrate open-source and third-party platforms alongside CloudWatch. TechTweek Infotech, an AWS Advanced Consulting Partner serving US clients across healthcare, fintech, and government, regularly deploys multi-layer monitoring architectures that blend native and third-party tools.
Prometheus is a time-series database and scraping engine that collects metrics from instrumented applications via HTTP pull. Unlike CloudWatch, Prometheus doesn’t require proprietary SDKs; it works with any application exposing metrics in the Prometheus text format. Prometheus excels at short-term, high-resolution metrics (1–15 second intervals) and advanced queries using PromQL. Teams running Kubernetes clusters on AWS EKS often choose Prometheus because:
- Pod and node metrics are automatically discovered via service discovery.
- Relabeling rules enable fine-grained tag-based filtering without modifying application code.
- Cost: Self-hosted Prometheus on EKS incurs only EC2/EBS storage costs (often $500–$2,000 per month for small deployments), avoiding the per-metric charges of CloudWatch custom metrics.
Grafana is a visualization and dashboarding platform that queries metrics from Prometheus, CloudWatch, Loki, Elasticsearch, and 50+ data sources. Grafana dashboards are more flexible than CloudWatch dashboards; teams create dynamic, templated dashboards that adjust to different environments (staging, production, disaster-recovery regions). Grafana Cloud, the SaaS offering, costs approximately $50–$200 per month for teams managing 10–20 production clusters. On-premises Grafana Enterprise licenses run $5,000–$20,000 annually, depending on usage.
Third-party platforms like Datadog, New Relic, Splunk, and Sumo Logic integrate deeply with AWS. They offer:
- Unified dashboarding across AWS and non-AWS infrastructure (on-premises data centers, multi-cloud).
- AI-driven anomaly detection and auto-remediation, reducing mean time to resolution (MTTR).
- Compliance-ready audit trails and data retention policies aligned with HIPAA, SOC 2 Type II, and FedRAMP requirements.
- Cost: Datadog, for example, charges $15–$40 per host per month, plus ingestion fees for logs and APM traces. A typical mid-sized US organization with 100 EC2 instances and 500 GB monthly logs pays $20,000–$40,000 monthly.
The decision to layer in Prometheus, Grafana, or commercial platforms depends on your team’s expertise, budget, and compliance posture. Healthcare providers under HIPAA often favor managed services (Datadog, New Relic) to shift compliance responsibility to the vendor. Government agencies using AWS GovCloud typically deploy self-hosted Prometheus and Grafana to maintain data sovereignty.
Alerting: Proactive Monitoring in Production
Alerting is where AWS cloud monitoring transforms from visibility into action. CloudWatch Alarms fire when metrics cross thresholds; composite alarms combine multiple conditions (e.g., “alert if CPU > 80% AND memory > 90% for 5 minutes”). The key to effective alerting is reducing false positives—excessive alerts cause alert fatigue, leading to missed real incidents.
Best practices for US-based teams:
- Baseline anomalies: Use CloudWatch Anomaly Detection (cost: $0.30 per anomaly detector per month) to alert on unusual patterns rather than hard thresholds. This is especially valuable for variable workloads (e-commerce sites with daily and seasonal spikes).
- Routing: Route critical alerts to on-call engineers via PagerDuty or Opsgenie; route non-critical alerts to Slack or email. This stratification respects team capacity and reduces burnout.
- Remediation: Pair alarms with Auto Scaling policies, Lambda functions for incident response, or runbook automation. A CPU spike might auto-scale application instances before human intervention.
- Documentation: For compliance audits (SOC 2, NIST CSF), maintain detailed alert runbooks. Auditors expect evidence that your team responds to alerts within defined SLAs—typically 15 minutes for critical issues, 1 hour for high priority.
Cost Visibility and Optimization
AWS cloud monitoring itself incurs costs. A comprehensive monitoring strategy spanning CloudWatch, X-Ray, and third-party tools can easily reach $10,000–$50,000 per month for enterprise deployments. Visibility into your monitoring costs is itself critical.
Use CloudWatch’s new Cost Anomaly Detection to alert when AWS service costs spike unexpectedly. Review CloudWatch Logs ingestion rates monthly; many teams find that verbose application logging can be tuned to reduce data by 30–50% without sacrificing debuggability. Enable S3 lifecycle policies to transition CloudWatch Logs exports to glacier, reducing long-term storage costs to pennies per GB annually.
Regulatory Compliance and Audit Trails
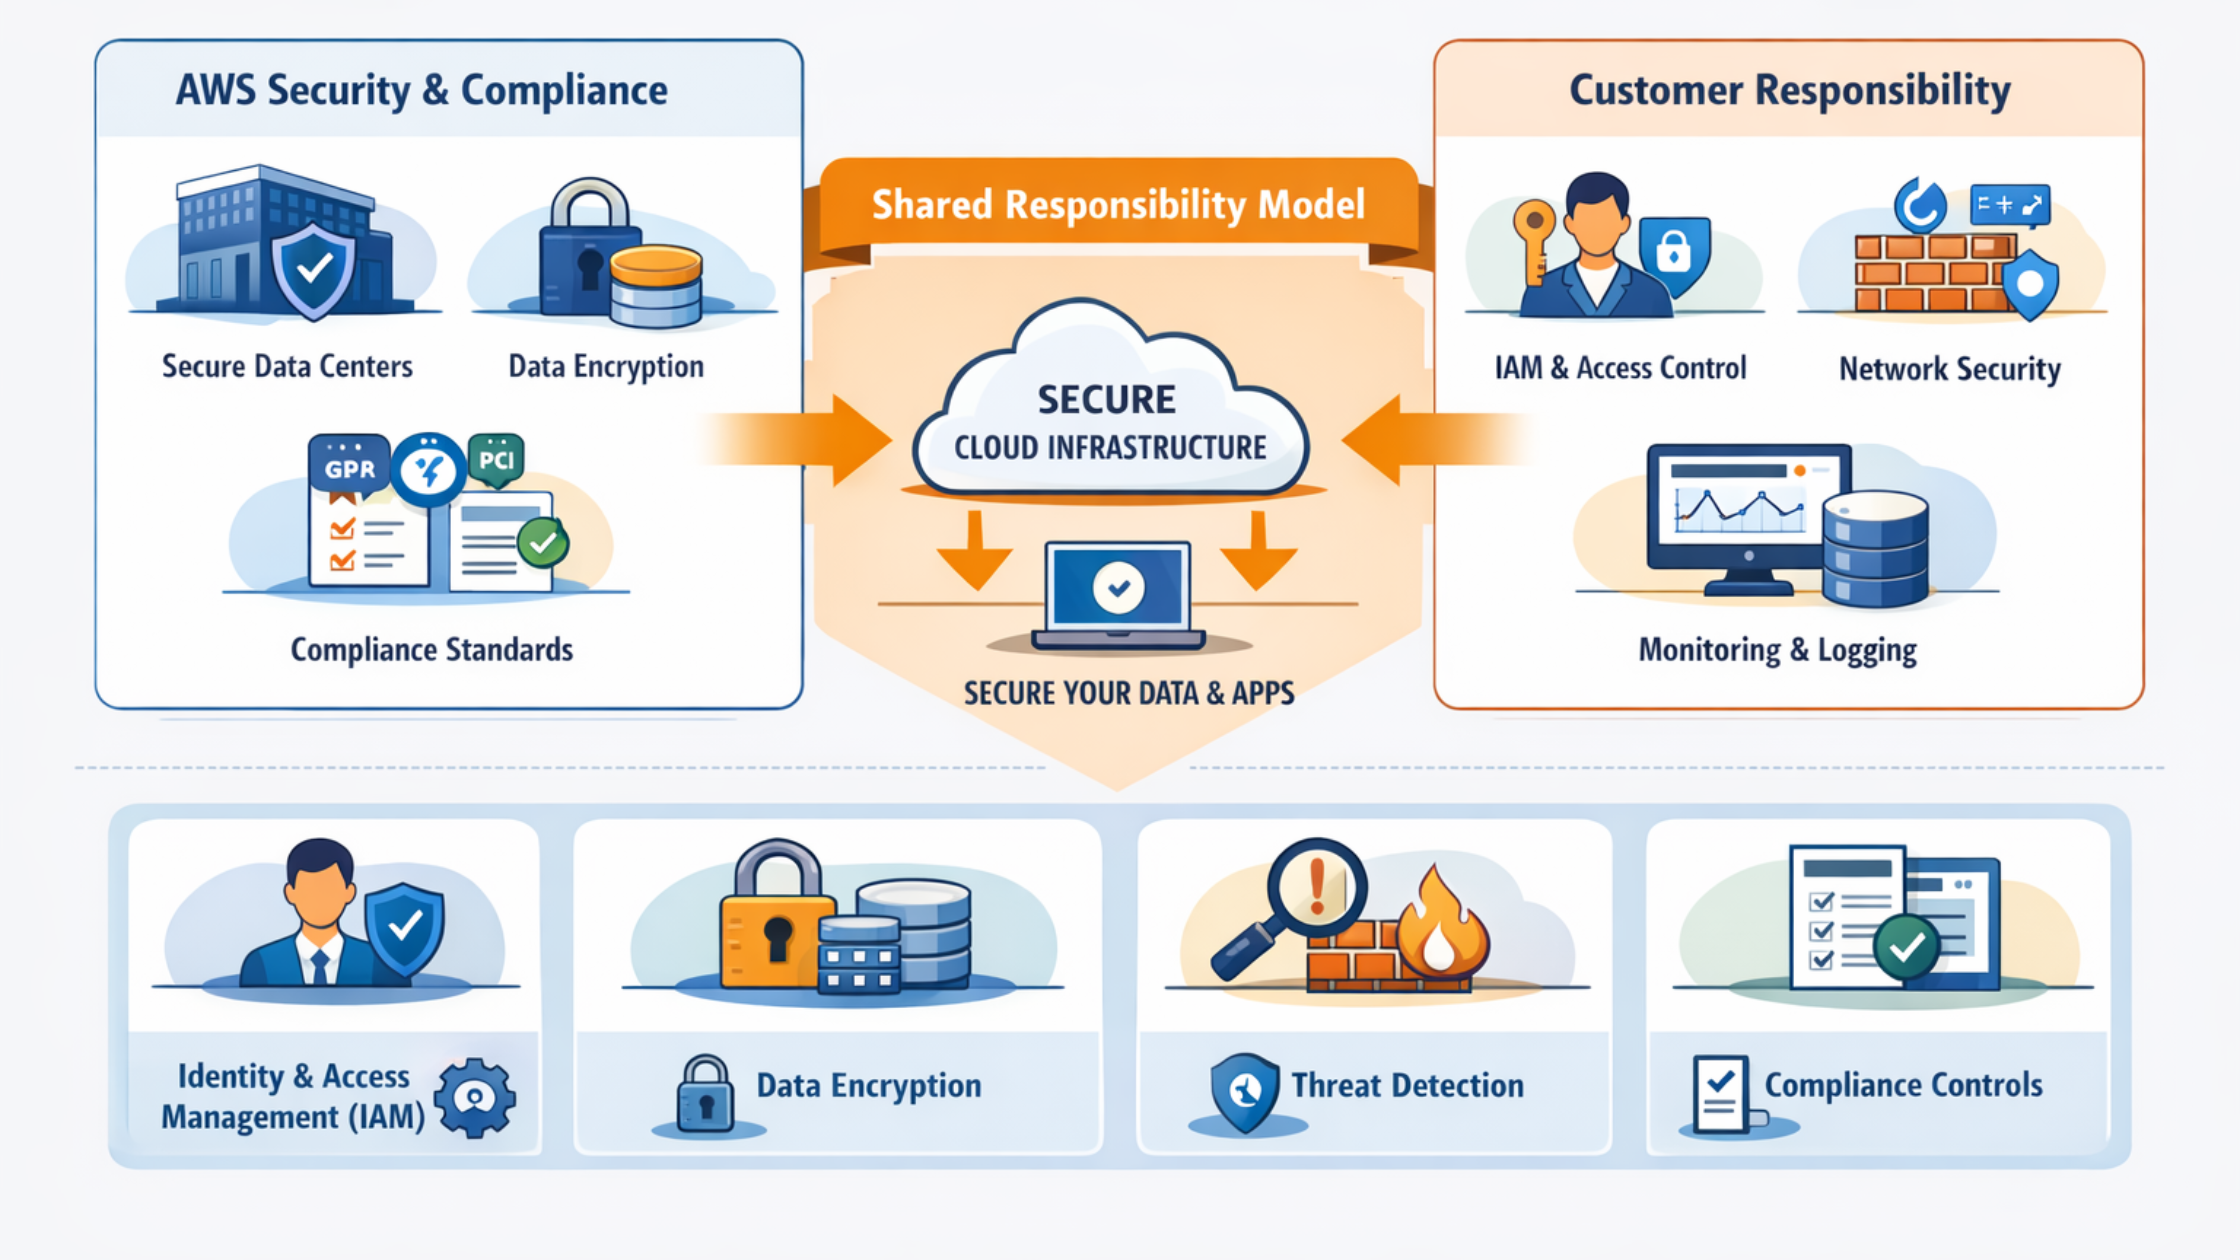
For US organizations subject to HIPAA (healthcare), SOC 2 Type II (SaaS), FedRAMP (government contractors), or CCPA/CPRA (California and other states), monitoring is a compliance requirement.
- HIPAA: CloudWatch Logs must be encrypted with AWS KMS. Enable CloudTrail logging for audit events. Log retention is typically 6–7 years.
- SOC 2: Demonstrate change detection (AWS Config), intrusion detection (GuardDuty), and incident response capabilities (documented alerts and runbooks).
- FedRAMP: Log centralization is mandatory. Deploy CloudWatch Logs in AWS GovCloud (us-gov-west-1 or us-gov-east-1). Most FedRAMP Moderate systems require 12–18 months of audit logs.
- NIST CSF: Use monitoring data to satisfy the Detect (DE) and Respond (RS) functions. CloudWatch metrics and X-Ray traces provide evidence of continuous monitoring.
TechTweek Infotech, with 24/7 follow-the-sun coverage from India, UK, and US data centers, helps US clients automate compliance evidence collection. Our DevSecOps and SRE teams integrate CloudWatch, Config, and GuardDuty into CI/CD pipelines, ensuring that every deployment is observable and auditable from day one.
Frequently Asked Questions
What’s the best AWS cloud monitoring setup for a startup?
Start with CloudWatch metrics and logs only. Enable detailed monitoring for production databases and app servers (add $2–5 per day). Build two or three CloudWatch dashboards. Keep alarms simple: CPU > 80%, error rate > 5%, disk usage > 85%. As you grow (50+ servers), evaluate Prometheus and Grafana to reduce per-metric costs. Most US startups transition to this hybrid model at Series A or B funding.
Should we use CloudWatch or Prometheus for Kubernetes on EKS?
Use both. Deploy Prometheus on EKS (via Helm) for application and node metrics; keep CloudWatch for AWS service metrics (RDS, ALB, NAT Gateway). Prometheus is faster for pod-level debugging; CloudWatch integrates with compliance tools (Config, GuardDuty). Cost is typically lower with Prometheus for Kubernetes workloads due to the per-metric pricing model of CloudWatch.
How do I reduce CloudWatch Logs costs?
Filter at the source: use log filters in application frameworks to exclude DEBUG and INFO logs in production. Archive logs to S3 after 30 days (CloudWatch exports cost $0.50 per 1,000 exports). Use log group retention policies; set non-prod environments to 7-day retention instead of indefinite. Typical savings: 40–60% reduction in monthly Logs ingestion costs.
Is CloudWatch compliant with HIPAA and CCPA?
Yes, if properly configured. Encrypt CloudWatch Logs with a customer-managed KMS key (not the default AWS-managed key). Enable MFA delete on S3 buckets where you archive logs. Use VPC endpoints for CloudWatch to avoid data traversing the public internet. For CCPA, implement automated log redaction (remove PII before ingestion). Audit these controls annually with your compliance team.
What’s the recommended approach for multi-region monitoring in us-east-1 and us-west-2?
Aggregate logs from both regions into a central CloudWatch Logs group in us-east-1 using cross-region log forwarding (via Kinesis or Lambda). Deploy Prometheus or Grafana in a central region with scrape targets in both regions, accepting 50–200ms latency. For critical applications, run independent alerting stacks in each region to avoid a single point of failure. Most enterprise deployments pair regional stacks with a global dashboard in Grafana Cloud.
Conclusion: Building Your AWS Cloud Monitoring Foundation
AWS cloud monitoring—anchored by CloudWatch but enhanced with Prometheus, Grafana, and third-party platforms—is the cornerstone of reliable, compliant cloud operations. Whether you’re running HIPAA-governed health systems in us-east-1, fintech applications on us-west-2, or FedRAMP workloads in AWS GovCloud, your monitoring strategy must balance cost, performance, and audit requirements.
TechTweek Infotech brings deep experience architecting multi-layer monitoring for US enterprises. Our AWS Advanced Consulting Partner status, combined with 24/7 follow-the-sun coverage and proven DevSecOps expertise, ensures your monitoring stack evolves with your business. Start with CloudWatch, layer in open-source tools as you scale, and maintain compliance at every step. For a deeper dive into how monitoring fits into your broader infrastructure strategy, explore our AWS Infrastructure Monitoring Services resource.